
FP&A, Planning & Analytics
FP&A Bought Better Planning Tools. The Budget Still Takes 8.7 Weeks.
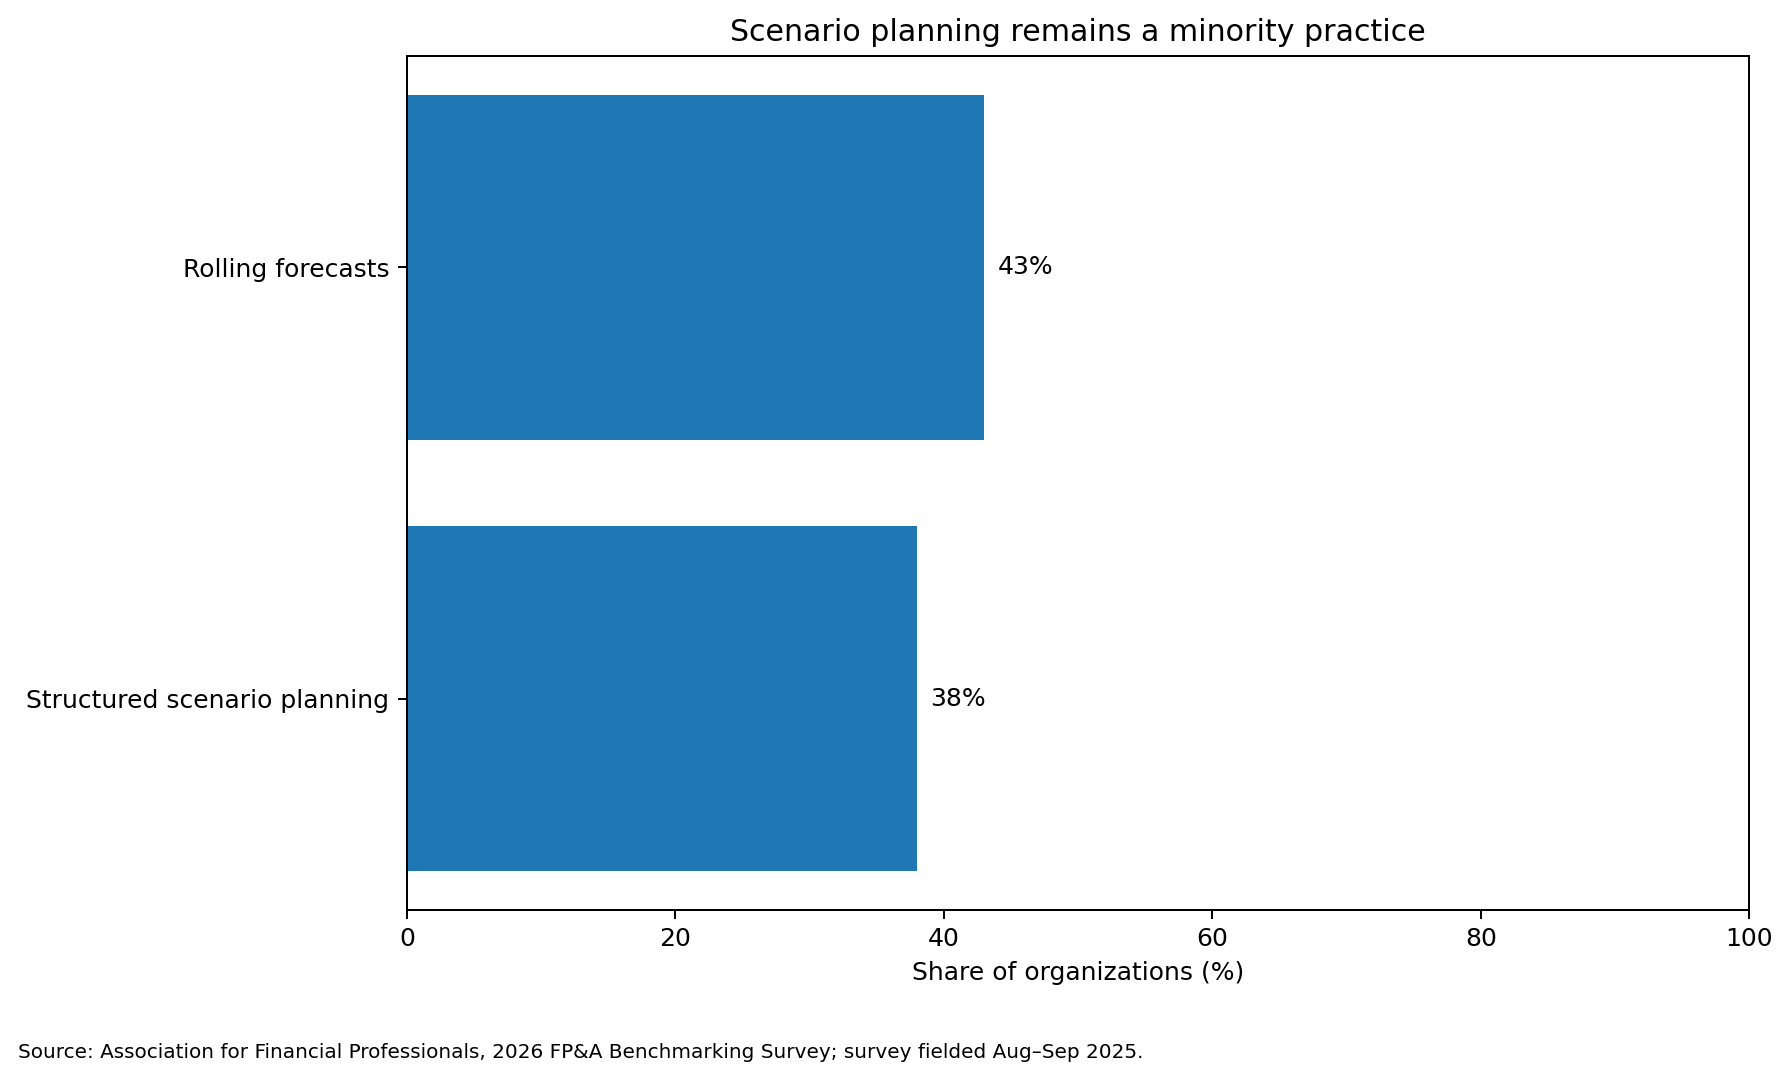
AFP’s 2026 benchmarking study finds a stubborn process problem: technology adoption has not shortened the average budgeting cycle in three years. The more interesting signal is behavioral — only 38% of organizations use structured scenario planning, yet those teams report faster budgets and stronger alignment.
For FP&A Analyst · FP&A Leader · VP Finance · CFO · Financial Analyst
Level All Levels

The most uncomfortable number in the Association for Financial Professionals’ 2026 FP&A benchmark is not 38%, the share of organizations that use structured scenario planning.
It is 8.7 weeks.
That is the average time respondents say it takes to produce a budget — essentially unchanged from three years earlier, according to AFP, despite broad investment in planning technology. For a function that has spent years adopting cloud planning platforms, automating data loads and promising more agile forecasting, a flat cycle-time benchmark is a useful warning: software deployment and planning redesign are not the same project.
AFP’s study, released in January 2026, surveyed 332 corporate finance practitioners globally in August and September 2025. It separates structured scenario planning from sensitivity analysis and examines how planning methods relate to budgeting speed, strategic alignment, risk management and execution.
The headline result is not that scenario planning has become standard. It has not. Only 38% of respondents use it.
The more useful finding is that the organizations that do use structured scenario planning report meaningfully different planning outcomes.
Scenario planning is still the exception
AFP defines structured scenario planning as considering a range of circumstances and projecting potential outcomes in order to prepare for multiple possible futures. It distinguishes that practice from sensitivity analysis, which changes one variable while holding others constant.
That distinction sounds academic until a real plan breaks.
Sensitivity analysis can tell FP&A what happens to operating income if gross margin falls 100 basis points. A structured scenario asks a wider question: What set of market, pricing, volume, capacity and cost conditions could create the downside case, how would those drivers interact, what indicators would signal that the scenario is emerging, and what management actions should already be defined?
The first is a model test. The second is a decision framework.
Yet only 38% of surveyed organizations report using structured scenario planning. Rolling forecasts are not ubiquitous either: AFP says 43% of organizations use them.
That gap matters because finance teams are operating in an environment where external assumptions can change faster than the annual budget process. The objective is not to predict every shock. It is to avoid rebuilding the decision logic from scratch every time one arrives.
The 8.1-week group
AFP reports that structured scenario planners complete budgets in an average of 8.1 weeks, compared with 9.2 weeks for organizations that do not use structured scenario planning. The association describes that as an 11% faster budget cycle.
The finding deserves both attention and restraint.
It is an observational comparison, not a controlled experiment. The survey does not prove that adopting structured scenario planning will mechanically remove 1.1 weeks from a company’s budget. More mature finance teams may be better at scenario planning and faster at budgeting for the same underlying reasons: clearer ownership, more standardized assumptions, stronger data, better business partnering or more disciplined calendars.
But that is precisely why the result is valuable.
Scenario planning may be functioning as a marker for a better-designed planning operating model — one in which assumptions are explicit, alternative outcomes are prebuilt, dependencies are understood and cross-functional conversations happen before the budget deadline becomes a reconciliation crisis.
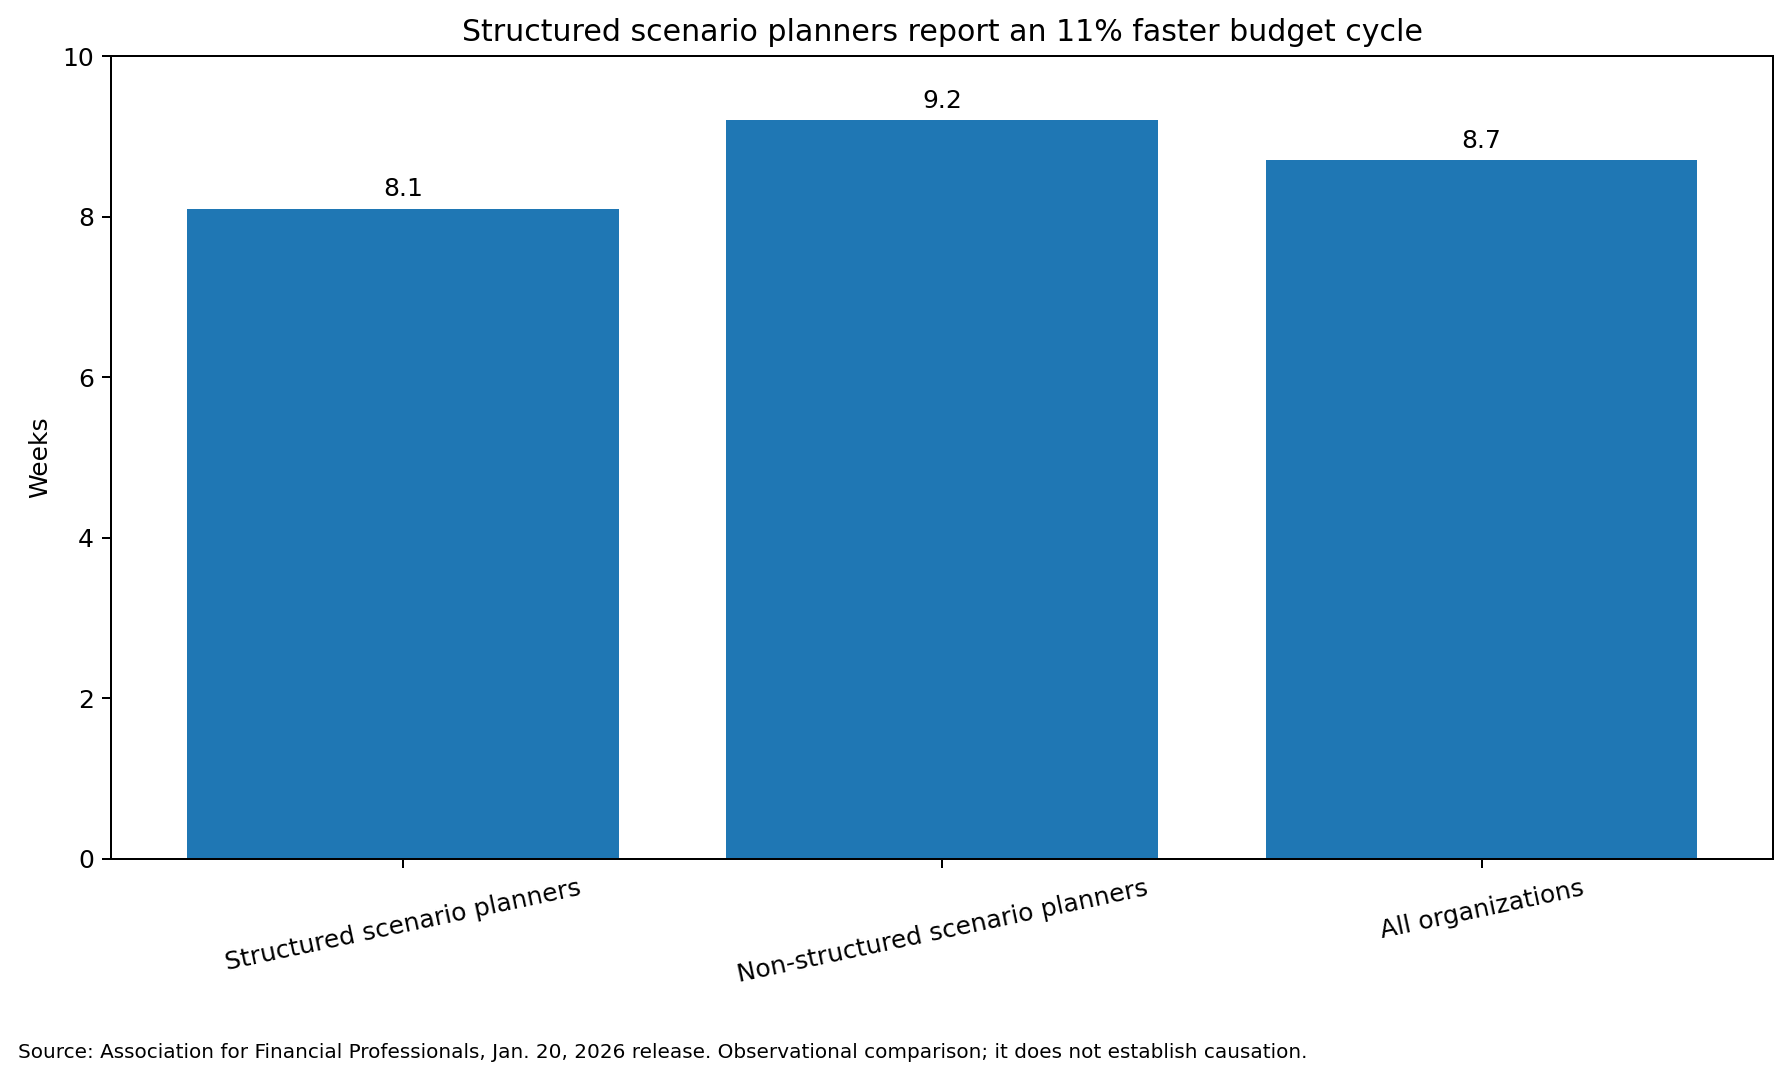
The contrast with the overall 8.7-week benchmark is striking. If technology investment alone were eliminating planning friction, average cycle time should be moving. AFP says it has not moved in three years.
That suggests the remaining bottleneck is increasingly organizational.
Where integrated planning actually breaks
The phrase “integrated planning” often gets reduced to a systems architecture: connect finance, sales, workforce and operations planning on one platform.
AFP’s data points to a harder problem. Integration can exist at the executive level and still fail in execution.
Only 46% of finance professionals surveyed report effective horizontal alignment across operations. Only 47% use consistent variables in planning. AFP also reports that finance professionals spend 21% of their time in areas beyond traditional finance, including strategy, technology implementation, HR and operations.
In other words, FP&A is becoming more cross-functional at the same time that cross-functional planning remains inconsistent.
This is where many planning transformations stall. A CFO and business-unit president can agree on the revenue target while sales capacity, hiring, procurement, production and cash assumptions remain built on different calendars and different definitions. The number is aligned; the operating model underneath it is not.
A unified planning application can expose that inconsistency faster. It cannot resolve the governance question of which assumption wins.
The alignment signal
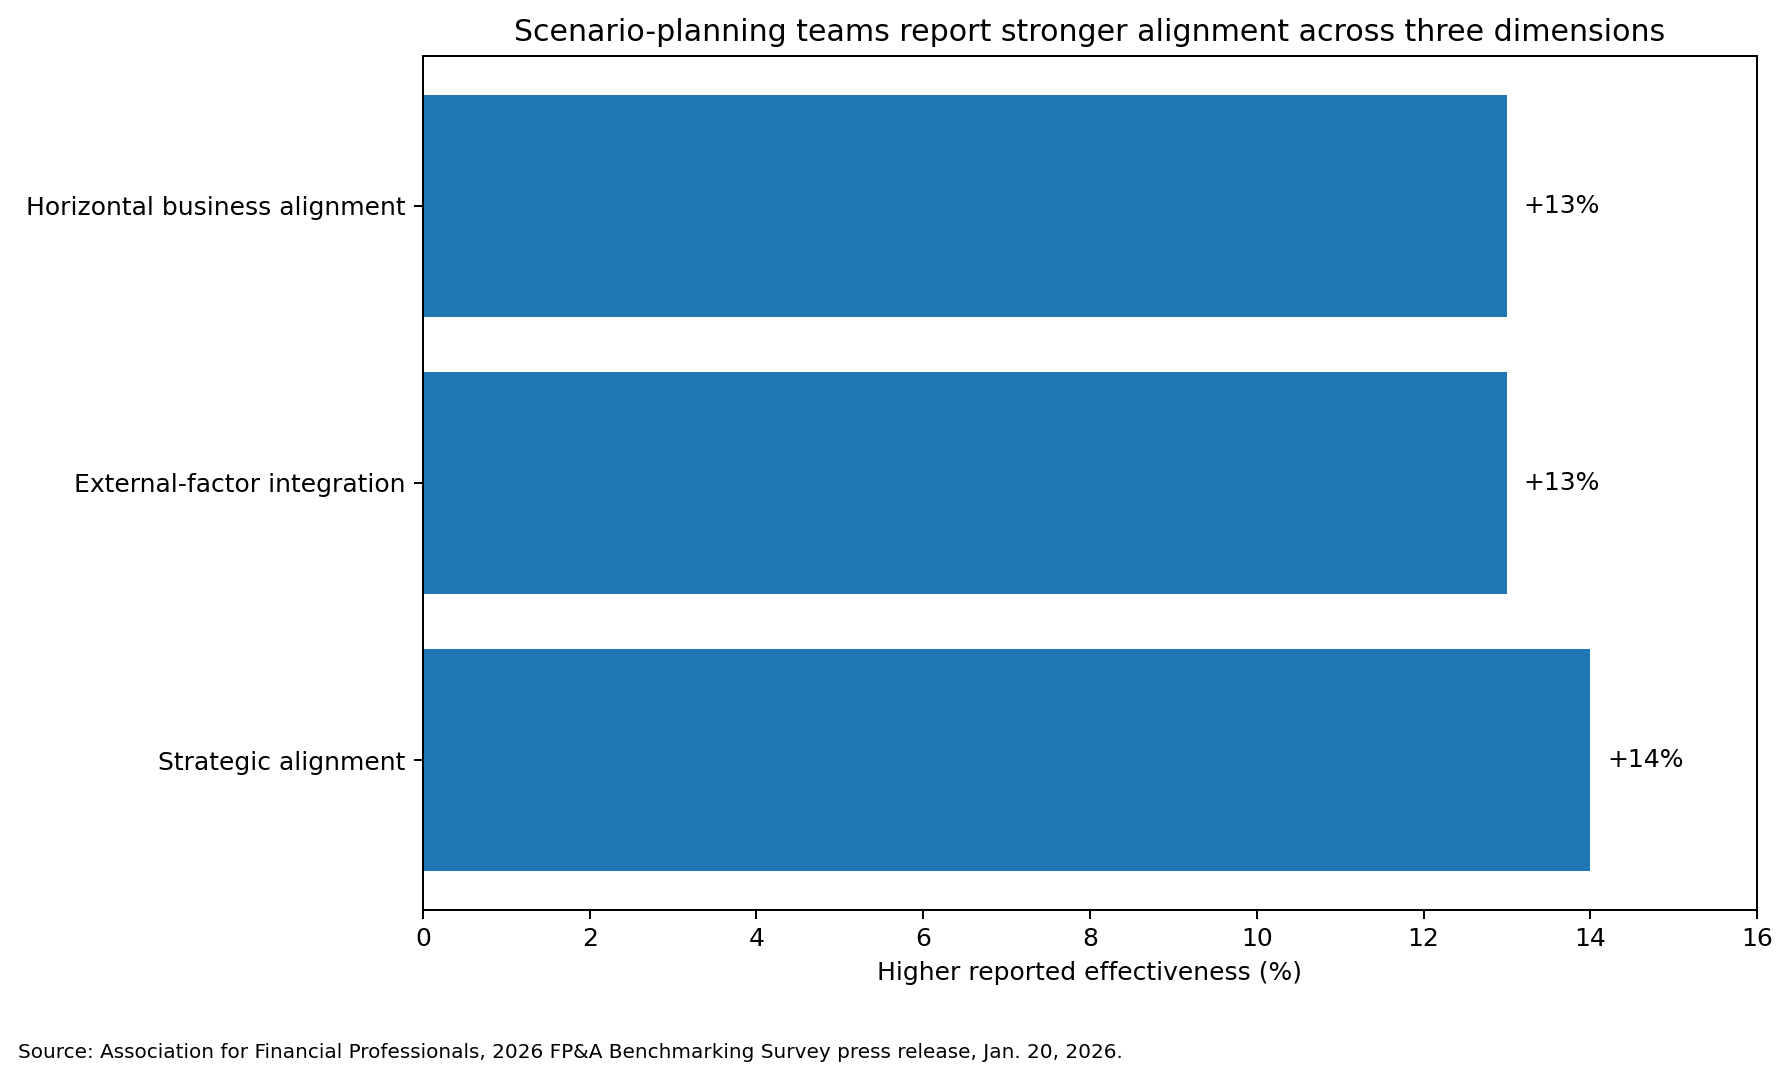
AFP reports that finance teams using structured scenario planning show 14% higher strategic alignment, 13% higher external-factor integration and 13% higher horizontal business alignment than peers that do not.
Again, those figures are associations, not proof of causality. But the pattern fits the mechanics of scenario planning.
A credible scenario cannot be built by finance alone. A demand downside requires commercial assumptions. A supply disruption requires operational constraints. A hiring slowdown requires workforce implications. A pricing response may change volume, working capital and margin at the same time.
To build scenarios properly, functions have to reveal their drivers and agree on how those drivers connect.
That conversation is integration.
This is also why scenario planning should not be confused with creating three copies of the budget labeled upside, base and downside. If each version is just a top-line percentage applied to the same model, the organization has produced three outputs, not three strategic views.
A structured scenario needs internal logic, trigger conditions and management responses.
Risk lists are common. Integrated response is not.
AFP’s risk data makes the same point from another angle.
Ninety percent of finance professionals use risk/opportunity lists, and 89% use contingency planning. Risk awareness, in other words, is widespread. Structured scenario planning is not.
The gap between those numbers is revealing. Many finance teams can enumerate what might go wrong or right. Fewer have embedded those possibilities into the planning model in a way that changes assumptions, financial outcomes and predefined decisions.
That is the operational difference between a risk register and a planning capability.
A useful FP&A process should be able to take a material risk — a demand slowdown, an input-cost spike, a delayed product launch — and translate it into a set of connected model changes. It should show the effect on revenue, margin, hiring, liquidity or capital allocation and identify the decision thresholds that matter.
The aim is not a larger scenario library. It is a shorter path from signal to decision.
Why planning technology can disappoint
The AFP benchmark should not be read as evidence that planning software does not matter. Modern platforms can remove enormous amounts of spreadsheet consolidation, version-control work, data loading and manual distribution.
The problem is that technology tends to accelerate the process it is given.
If a company still runs a sequential budgeting calendar in which each function submits a plan, finance reconciles the submissions, executives challenge the result, assumptions change, and every function resubmits, a faster platform may simply execute more iterations of the same design.
If drivers are inconsistent, automation makes inconsistency flow faster.
If decision rights are unclear, workflow routes the disagreement efficiently.
If every scenario requires a one-off modeling exercise, more compute does not create preparedness.
This is the “tech paradox” behind the 8.7-week number. The platform layer may have improved while the management process sitting on top of it has not changed enough to show up in cycle time.
A more useful redesign target than “faster budgeting”
Finance teams preparing for the next planning cycle can use the AFP findings as a diagnostic rather than a benchmark race.
- 01Identify the assumptions that genuinely connect functions: volume, price, headcount, capacity, utilization, wage inflation, commodity cost, customer churn or whatever drives the business model. Assign an owner to each and define one source of truth.
- 02Separate targets from forecasts. A target expresses ambition or accountability. A forecast should remain an unbiased view of likely performance. When the two are forced into one number, the organization creates incentives to defend the plan rather than update it.
- 03Build a small number of structured scenarios around decisions, not macroeconomic storytelling. Each scenario should have explicit drivers, trigger indicators, financial consequences and management actions.
- 04Connect risk and opportunity management to the reforecast cadence. A risk that never changes the forecast, a scenario or a decision threshold is being documented, not managed.
- 05Measure planning efficiency beyond elapsed weeks. Count manual handoffs, assumption resets, reconciliation loops, late submissions and versions created. Those metrics reveal where time is actually being lost.
The finding FP&A leaders should keep
AFP’s benchmark does not offer a software winner or a universal planning template.
It offers a more useful challenge.
Finance teams have spent heavily to make planning systems more capable. The average budgeting cycle in this survey is still 8.7 weeks. Structured scenario planning remains a minority practice. Horizontal alignment remains weak for more than half of respondents.
The next productivity gain may therefore come less from another layer of functionality and more from redesigning how the organization uses the planning system it already has.
That is a harder project than buying software because it requires explicit assumptions, shared definitions, decision rights and cross-functional discipline.
It is also where the benchmark points.
The teams reporting stronger results are not simply producing a better single forecast. They are maintaining multiple credible views of the future and using the planning process to decide what the company will do if one of those futures begins to arrive.
Key takeaways
- For FP&A analysts
- Build scenarios with explicit drivers, trigger indicators and defined responses — not three copies of the budget with different top-line percentages.
- For FP&A managers
- Measure planning efficiency beyond elapsed weeks: handoffs, assumption resets, reconciliation loops and versions created.
- For finance leaders
- A faster platform accelerates whatever process it is given. Assumption ownership and decision rights are the constraint the software cannot fix.
- For CFOs
- The average budget cycle has not moved in three years. The next gain likely comes from redesigning use of the existing planning system.
Sources & further reading
- Association for Financial Professionals2026 AFP FP&A Benchmarking Survey Report: Integrated PlanningPublished 2026
- Association for Financial ProfessionalsAFP Survey Reveals Structured Scenario Planning Separates Top-Performing Corporate Finance TeamsJanuary 20, 2026
- AFP / Bryan LapidusPlanning for an Uncertain Future: Why FP&A Must Let Go of False PrecisionFebruary 25, 2026
AFP’s survey was fielded August–September 2025 among 332 corporate finance practitioners globally. Reported differences between scenario-planning users and non-users are observational and do not establish causation. Charts reproduce only values stated in the AFP source; no post–September 6, 2026 evidence is used.
- For
- FP&A Analyst · FP&A Leader · VP Finance · CFO · Financial Analyst
- Level
- All Levels

About the author
Daniel BrooksFP&A & Analytics Editor
Daniel covers planning, forecasting and financial analytics, focusing on how finance teams are using better data, technology and new planning methods to improve business decisions.
The Finance Observer content is for informational purposes only and is not professional financial, tax, legal or investment advice.
Related reading

Most Finance Teams Still Don’t Do Structured Scenario Planning. That Is Becoming Expensive.
AFP’s 2026 benchmark of 332 finance professionals finds structured scenario planning is still a minority practice, while the average budgeting cycle stays near nine weeks despite years of planning-technology investment.
The Forecast Is Becoming a Living System
FP&A is moving from periodic forecasting toward a continuously updated view of the business — but spreadsheets, fragmented data and process design still stand in the way.

FP&A Bought More Tools. The Data Problem Got Worse.
AFP’s 2025 benchmark found unreliable and inaccessible data are still FP&A’s biggest technology obstacles, with spreadsheets nearly universal — the next upgrade is the information supply chain, not another application.
Related across formats
Curated video and audio that share this article's finance topics.
The CFO Playbook
Editor's PickThe Operator CFO: Turning Growth Ambition Into Margin, Cash and Accountability
Benzinga CFO Robert Checchia, with host David McClelland, explains why finance leaders need to get closer to operations, give P&L owners clearer numbers and connect growth decisions to margin and cash generation — plus prioritization under private-equity ownership and AI experimentation with guardrails.
CFO Thought Leader / Planning Aces
Editor's PickFinance Leaders Decode AI's Promise
Finance leaders explore AI agents for analytics, experimentation and order-to-cash checks, along with reconciliations, data readiness and opportunities to dramatically shorten finance cycle times.